1
 Sep 30, 2018
— https://sf.gl/1622
Sep 30, 2018
— https://sf.gl/1622
Tips and tricks for htop
If you've ever logged in to a Linux server to check what's going on, you're probably using htop, a text-based system monitoring tool for Unix based systems.
It runs on most Unix systems, including OS X, via Homebrew: brew install htop
For apt-based systems, like Debian and Ubuntu: apt-get install htop
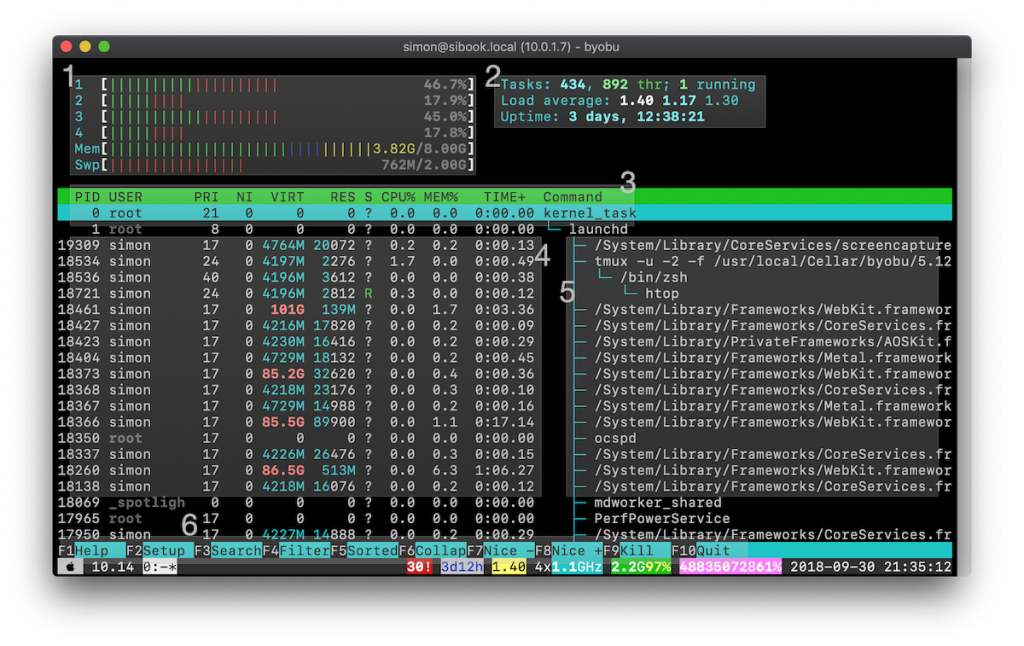 htoprunning in a byobu session; numbers correspond to list below
Basic Usage
- The graph at the top display the CPU usage (each CPU core gets a line, my CPU was 4 hyper threads = 4 lines). For an explanation of what the different colors indicate, see below.
- To the right of the graph, the amount of processes and threads, load average (1, 5, 15 mins) and the system uptime is shown.
- Has the columns. How to add more is shown below.
- The default columns:
- PID is the process ID
- PRI ("Priority") is -20 (highest), 19 (lowest)
- VIRT is total theoretical (virtual) memory mapped by program. Can be many times greater than the actual amount of physical memory.
- RES ("Resident") shows the actual amount of physical memory used
- S ("Status")
S = sleeping (idle)
R = running
D = disk sleep (uninterruptible)
Z = zombie (waiting for parent to read its exit status)
T = traced or suspended (e.g by SIGTSTP)
W = paging
? = unknown - CPU% is the total amount of CPU usage
- TIME is how much total cpu time that process has been using
- The process path and name. See below for shortcuts to display environment, etc.
- At the bottom are the menu items: mouse can be used in addition to F keys, if enabled.
CPU and Memory graph colors
CPU – Default mode
- Blue: low priority processes (nice > 0)
- Green: normal (user) processes
- Red: kernel time (kernel, iowait, irqs...)
- Orange: virt time (steal time + guest time)
CPU – Detailed mode
If you have enabled "Detailed CPU time" in Setup > Display Options, the colors mean the following:
- Blue: low priority threads (nice > 0)
- Green: normal (user) processes
- Red: system (kernel) processes
- Yellow: IRQ time
- Magenta: Soft IRQ time
- Grey: IO Wait time
- Cyan: Steal time/Guest time
Memory
- Green: Used memory pages
- Blue: Buffer pages
- Orange: Cache pages
- Grey: Free (unused)
Hide threads
Per default htop shows threads of non-system programs, but this can result in the list being very verbose (leading to a bunch of duplicate program names in green text) and the program becoming hard to navigate.
To turn off thread visibility go to Setup > Display Options and check off both "Hide kernel threads" and "Hide userland process threads".
Alternatively, kernel and user threads can be toggled with K and H, respectively.
Use the mouse
While htop is a text-mode application, on most terminals, you can use a mouse cursor to select processes as well as click the menu keys and navigate the Setup menu.
Selecting one or more processes
With the SPACE key, you can select multiple processes. You can them kill them via F9.
Other things to do with a selected process:
- To view the environment variables of a specific process, just navigate to the process via the arrow keys and press E.
- Set IO priority via I.
- List open files with lsof with L.
- Trace syscalls with S.
- Toggle path with P.
Add some more columns
Per default, htop doesn't show all its information. To add more columns, go to Setup > Columns and choose some new ones. Which to choose? Here's the ones I commonly use:
- PERCENT_CPU, PERCENT_MEMORY – shows how much a program is using in percentages
- IO_RATE – shows how much disk IO the process is using
Filter by users
To select and view a specific users' processes, type U.
Feb 7, 2020 at 9:25
PERCENT_CPU and PERCENT_MEMORY are comes in by default.
However IO_RATE can be very useful.
Thank you for tutorial though, finally got rid of PRI, VIRT and RES; never needed those.