0

Office Dashboards with Raspberry Pi
If you're in need of a simple computer to drive an infoscreen, which usually just consists of showing a website in fullscreen, Raspberry Pi computers are a great choice. They're cheap, newer versions have WiFi and HDMI output, and they're small – so they're easy to mount on the back of a TV.
Even better, most never TVs have a USB port nowadays, so for a power source, just plug your Pi in to the TV.

One problem, however, is that it gets increasingly hard to control the infoscreens the more you add. For example, if you have 6, you don't want to have to manage them independently, and you want to be able to change the setup quickly.
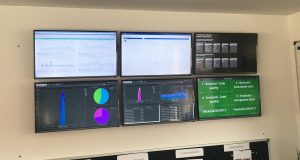
At the office, we've set up 6 Samsung TVs, each with their own Pi. On each is a different dashboard:
- Zabbix (server monitoring),
- Kibana (log & performance monitoring),
- Jenkins (build status, with plugins like Build Monitor View and Delivery Pipeline Plugin),
- JIRA (showing tickets remaining in a sprint, and so forth.)
What I ended up with is a simple provisioning script that configures the Pi:
Quite a bit is happening here – in order:
- WiFi power management is disabled. I've found that it makes WiFi very unstable on the Pis.
- We need to set the hostname; every pi needs a unique one. We'll see why later.
- The desktop wallpaper is changed. You can remove this part if you like raspberries!
- Chromium is installed. I tried Midori, and others. Chromium just works.
- We setup a script that starts when the desktop session loads, startup.sh. This will run Chromium.
- Then we reboot to apply the hostname change.
In the script, there's two things you must modify: URLs to the desktop wallpaper and the directory to the dashboard files.
So what's the dashboard files?
The way it works is this: if the hostname of the Pi is raspberry-pi-1 and you set dashboard_files_url to https://mycorp.com/files/dashboard/, the Pi will go to https://mycorp.com/files/dashboard/raspberry-pi-1.html – that way, if you want to change the URL of one of your screens, you just have to change a file on your Web server.
While you could do more about it and make a script on your server, I just went with simple html files with a meta-refresh redirect.
I feel that it's easier to manage this stuff from a central place rather than SSHing into several different machines.
Do you have a better way of managing your dashboards? Do you have a cool dashboard you've designed? Tell us in the comments!
Update regarding Chromium and disable-session-crashed-bubble switch
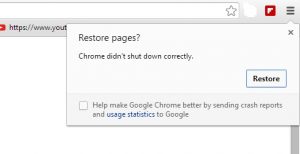
 Newer updates of Chromium removed support for the --disable-session-crashed-bubble that disabled the "Restore pages?" pop-up.
This is annoying since we cut off power to the Raspberry Pi's to shut them down, and a power cut triggers the popup.
Even more annoying, alternative browsers on the Raspberry Pi like Midori or kweb can't run the newest Kibana – a dashboard used for monitoring – at all, so I had to find a workaround for this.
The alternative I found was that you can use the --incognito switch, which will prevent the popup, but then you can't use dashboard that require a cookie to be present (ie. because of login), like Zabbix or Jenkins.
If --incognito won't do, the solution I found so far was to use xte to simulate a click on the X button of the dialog. It's stupid, I know, but since the Chromium developers don't think anyone is using that feature, there you go.
Note that you might want to change the mouse coordinates to where the X button is.
#!/bin/sh

# Close that fucking session crashed bubble
sleep 60
xte "mousemove 1809 20" -x:0
sleep 1
xte "mouseclick 1" -x:0
If you have a better solution, don't hesitate to write in the comments!